For the sector as a whole, key performance indicators have also been collected. It turns out that, after a correction in the agricultural census, the total acreage is much larger than assumed in 2018. Furthermore, the scale of businesses has once again increased.
Findings
While compiling this periodically published reference work, the following findings emerged:
Industry-wide
- The total greenhouse acreage in 2022 was 18% larger than in 2018, primarily due to a correction in the agricultural census rather than a physical increase in greenhouse acreage.
- Scale enlargement has continued, with 77% of the acreage owned by companies larger than 3 hectares and 63% by those larger than 5 hectares. This 63% is controlled by 16% of the total number of companies. The total number of companies has decreased by 68% since 2000.
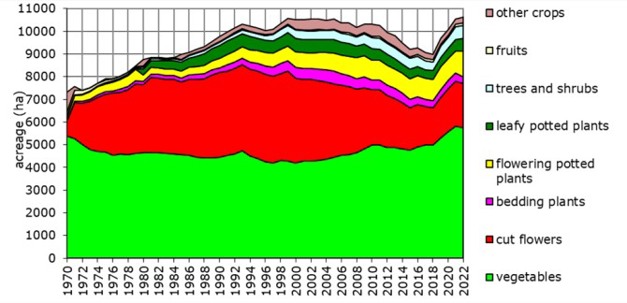
- The acreage of vegetables has remained relatively stable. The acreages of tomatoes and peppers increased by 7% and 26%, respectively, from 2012 to 2022, while greenhouse strawberry acreage saw the strongest growth at 93%.
- The cut flower acreage has decreased by 58% since 2008. The major representatives of cut flower acreage (roses and chrysanthemums) shrank by 39% and 72%, respectively, during that period.
- The potted plant acreage has increased by 29% since 2012, whilst container plant acreage has declined.
Financially
- Differences in cultivation methods result in variations in production costs and significant differences in the carbon footprint.
- The average financial production cost exceeds the realized selling price for various crops.
- For many unlit crops, the use of combined heat and power (CHP) systems remains profitable, mainly due to the ongoing exemption from energy taxes for CHP gas. Additionally, using CHP results in a more favorable carbon footprint.
As there is increasing demand for the environmental impact of cultivation, the carbon footprint has been calculated for each crop, broken down by different production factors. In the 2023 version, each balance sheet also provides an indication of annual evapotranspiration and the amount of natural gas required for sufficient CO2 dosage in the summer.
In recent years, greenhouse horticulture has faced significant price increases in durable production assets, interest rates, energy, and labor, amongst other factors. In Quantitative Information for Dutch Greenhouse Horticulture 2023, 126 different balance sheets have been prepared for 60 crops. For vegetables and cut flowers, the cost price per kg or per piece has been calculated for each four-week period. This includes the production and purchasing of natural gas, electricity, CO2, and labor for each period. For potter- and container plants, these figures are calculated per 1000 plants.